Net Worth
The Net Worth tool tracks the net sum of all your assets and liabilities over time.
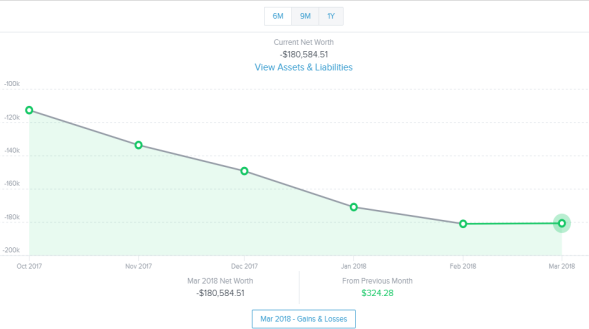
The Net Worth tool tracks the net sum of all your assets and liabilities over the past year. The dots on the graph represent your net worth for each month, while the lines on the graph represent the change in your month-to-month net worth.
Using the Net Worth tool
- Adjust the time frame by choosing a date range from the tabs above.
- Double-click a circle on the line chart to see your net worth's gains and losses. A window appears showing the amount of change that occurred within each of your accounts during that month.
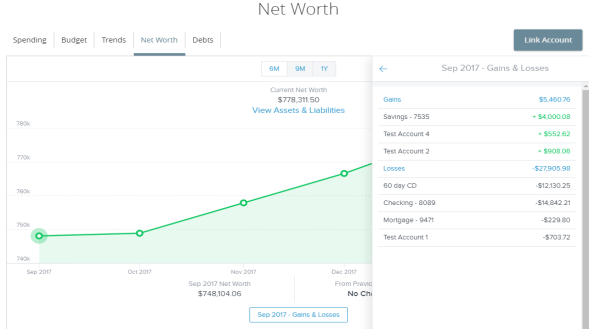
- Select one of the accounts to display the associated transactions.
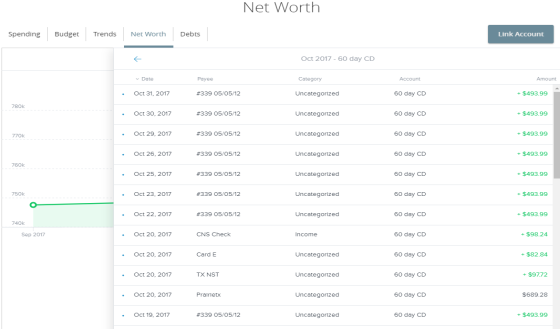
- Select an individual transaction to view and edit the transaction details.
Note: Tags only appear within Financial Tools.They do not appear on the Account Details page and are not used for anything within digital banking at this time.
The Net Worth tool tracks the net sum of all your assets and liabilities over the amount of time you specify. The bars on the graph represent your assets and liabilities for each month. You can view your total net worth and the change in your net worth for each month in the blue bar on the bottom of the graph.
Using the Net Worth tool
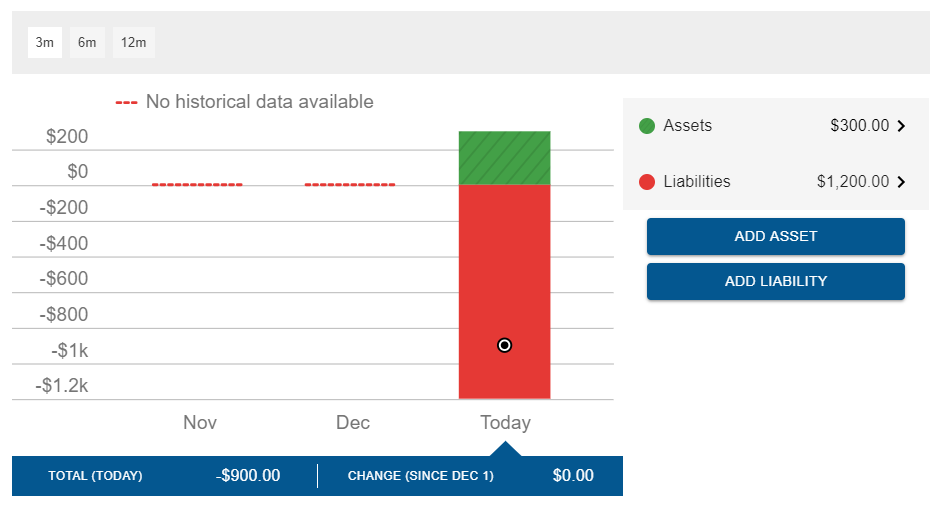
- Adjust the time frame by choosing from the tabs above the graph.
- Select the Assets or Liabilities options on the right to view a current list of assets or liabilities. Select an asset or liability to view details about the asset or liability.
- To add assets or liabilities, select Add Asset or Add Liability.